The value of non-alcoholic beverages imported into Sweden increased from 2010 to 2022. In 2022, the import value of non-alcoholic beverages into Sweden was roughly 4.4 billion Swedish kronor.
Value of non-alcoholic beverages imported into Sweden from 2010 to 2022 (in million SEK)
Basic Account
Get to know the platform
You only have access to basic statistics.
This statistic is not included in your account.
Starter Account
The ideal entry-level account for individual users
- Instant access to 1m statistics
- Download in XLS, PDF & PNG format
- Detailed references
$199 USD / Month *
Professional Account
Full access
Business Solutions including all features.
* Prices do not include sales tax.
Other statistics that may interest you Non-alcoholic beverages industry in Sweden
Overview
6
- Premium Statistic Quarterly sales volume of nonalcoholic beverages in Systembolaget in Sweden 2020-2023
- Premium Statistic Consumer price index (CPI) of non-alcoholic beverages in Sweden 2012-2022
- Premium Statistic Import value of beverages into Sweden 2011-2022
- Premium Statistic Export value of beverages from Sweden 2010-2022
- Premium Statistic 
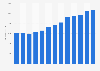
Import value of non-alcoholic beverages into Sweden 2010-2022
- Premium Statistic Export value of non-alcoholic beverages from Sweden 2010-2022
International trade
6
- Premium Statistic Import value of waters into Sweden 2010-2022
- Premium Statistic Export value of waters from Sweden 2010-2022
- Premium Statistic Import value of fruit and vegetable juices into Sweden 2010-2022
- Premium Statistic Export value of fruit and vegetable juices from Sweden 2010-2022
- Premium Statistic Export value of tomato juice from Sweden 2011-2022
- Premium Statistic Import value of tomato juice into Sweden 2011-2022
Retail
6
- Premium Statistic Retail sales turnover of soft drinks, mineral waters, juices in Sweden 2010-2022
- Premium Statistic Sales turnover of soft drinks and mineral water for retail trade in Sweden 2009-2022
- Premium Statistic Quarterly sales of organic nonalcoholic drinks in Systembolaget in Sweden 2020-2023
- Premium Statistic Sales volume of non-alcoholic beverages in Systembolaget in Sweden 2022, by supplier
- Premium Statistic Sales value of non-alcoholic beverages in Systembolaget in Sweden 2022, by supplier
- Premium Statistic Sales volume of non-alcoholic beverage brands in Systembolaget stores in Sweden 2019
CPI and expenditure
5
- Premium Statistic Household consumption expenditure on non-alcoholic beverages in Sweden 2010-2021
- Premium Statistic Household consumption expenditure on water, juice and soft drinks in Sweden 2010-2021
- Premium Statistic Consumer price index (CPI) of cold non-alcoholic beverages in Sweden 2012-2022
- Premium Statistic Consumer price index (CPI) of non-alcoholic beverages in Sweden monthly 2021-2023
- Premium Statistic Consumer price index (CPI) of cold non-alcoholic beverage in Sweden monthly 2021-2023
Further related statistics
14
- Import value of beverages and tobacco into Denmark 2009-2020
- Import partners of Denmark for beverages 2016, by import value
- Import value of alcoholic beverages into Norway 2009-2022
- Value of exported beverages and tobacco from Greenland 2014-2019
- Value of imported beverages and tobacco into Greenland 2014-2019
- Import value of beverages and tobacco Malaysia 2013-2022
- Distribution of Spanish food and beverage imports 2018-2019, by country of origin
- Major suppliers of beverage imports to Japan 2014, by import value
- Food and beverage import value of Qatar 2007-2018
- Volume share of main imports in the Spanish food and beverage industry 2018
- Aruba: wine and beer imports share 2017, by country
- Waters and soft drinks import value from the EU to Japan 2012-2016
- Value of primary food and beverage imports in Saudi Arabia 2011-2015
- Import value of beverages and tobacco in Poland 2016-2022
Further Content: You might find this interesting as well
Statistics
- Import value of beverages and tobacco into Denmark 2009-2020
- Import partners of Denmark for beverages 2016, by import value
- Import value of alcoholic beverages into Norway 2009-2022
- Value of exported beverages and tobacco from Greenland 2014-2019
- Value of imported beverages and tobacco into Greenland 2014-2019
- Import value of beverages and tobacco Malaysia 2013-2022
- Distribution of Spanish food and beverage imports 2018-2019, by country of origin
- Major suppliers of beverage imports to Japan 2014, by import value
- Food and beverage import value of Qatar 2007-2018
- Volume share of main imports in the Spanish food and beverage industry 2018
- Aruba: wine and beer imports share 2017, by country
- Waters and soft drinks import value from the EU to Japan 2012-2016
- Value of primary food and beverage imports in Saudi Arabia 2011-2015
- Import value of beverages and tobacco in Poland 2016-2022
Statistics Sweden. (October 26, 2023). Value of non-alcoholic beverages imported into Sweden from 2010 to 2022 (in million SEK) [Graph]. In Statista. Retrieved June 01, 2024, from https://www.statista.com/statistics/549584/import-value-of-non-alcoholic-beverages-into-sweden/
Statistics Sweden. "Value of non-alcoholic beverages imported into Sweden from 2010 to 2022 (in million SEK)." Chart. October 26, 2023. Statista. Accessed June 01, 2024. https://www.statista.com/statistics/549584/import-value-of-non-alcoholic-beverages-into-sweden/
Statistics Sweden. (2023). Value of non-alcoholic beverages imported into Sweden from 2010 to 2022 (in million SEK). Statista. Statista Inc.. Accessed: June 01, 2024. https://www.statista.com/statistics/549584/import-value-of-non-alcoholic-beverages-into-sweden/
Statistics Sweden. "Value of Non-alcoholic Beverages Imported into Sweden from 2010 to 2022 (in Million Sek)." Statista, Statista Inc., 26 Oct 2023, https://www.statista.com/statistics/549584/import-value-of-non-alcoholic-beverages-into-sweden/
Statistics Sweden, Value of non-alcoholic beverages imported into Sweden from 2010 to 2022 (in million SEK) Statista, https://www.statista.com/statistics/549584/import-value-of-non-alcoholic-beverages-into-sweden/ (last visited June 01, 2024)
Value of non-alcoholic beverages imported into Sweden from 2010 to 2022 (in million SEK) [Graph], Statistics Sweden, October 26, 2023. [Online]. Available: https://www.statista.com/statistics/549584/import-value-of-non-alcoholic-beverages-into-sweden/