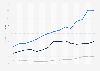
This statistic depicts the quantity of shoe consumed in selected Middle East and North African countries in 2018. In 2018, the number of shoes consumed in the United Arab Emirates totaled about 292 million, compared to 12 million pairs in Lebanon.
Quantity of shoes consumed in Middle East and North Africa in 2018, by country (in million pairs)
Basic Account
Get to know the platform
You only have access to basic statistics.
This statistic is not included in your account.
Starter Account
The ideal entry-level account for individual users
- Instant access to 1m statistics
- Download in XLS, PDF & PNG format
- Detailed references
$199 USD / Month *
Professional Account
Full access
Business Solutions including all features.
* Prices do not include sales tax.
Other statistics that may interest you Statistics on
About the industry
10
- Premium Statistic Share of shoe imports into Algeria by material 2018
- Premium Statistic Share of shoe imports into Egypt by material 2018
- Premium Statistic Share of shoe imports into Lebanon by material 2018
- Premium Statistic Share of shoe imports into Morocco by material 2018
- Premium Statistic Share of shoe imports into Saudi Arabia by material 2018
- Premium Statistic Share of shoe imports into Tunisia by material 2018
- Premium Statistic Share of shoe imports into the UAE by material 2018
- Premium Statistic Share of shoe imports value into Morocco 2020, by country
- Premium Statistic Share of shoe imports value into the UAE by select country 2018
- Premium Statistic Share of shoe imports value into Egypt by select country 2018
About the region
10
- Premium Statistic Leading 5 footwear exporters of Africa 2022, based on export value
- Basic Statistic Value of U.S. apparel exports to Africa 2005-2022
- Basic Statistic Value of apparel imports from Africa to the U.S. 2005-2022
- Premium Statistic Number of Zara stores in EMEA in 2016-2024, by country
- Basic Statistic Inditex Group's number of stores in Asia and Africa 2023, by region
- Premium Statistic Annual cocoa production of Africa by country 2018/19-2022/23
- Basic Statistic Breakdown of U.S. apparel exports to Africa in 2021, by product
- Basic Statistic Breakdown of U.S. apparel imports from Africa in 2020, by product
- Basic Statistic Breakdown of U.S. textiles and fabrics exports to Africa in 2020, by product
- Basic Statistic Breakdown of textile and fabric imports from Africa to the U.S. in 2020, by product
Selected statistics
1
Other regions
9
- Premium Statistic Share of shoe imports value into Lebanon by select country 2018
- Premium Statistic Share of shoe imports value into Saudi Arabia by select country 2018
- Basic Statistic Puma Group's gross profit worldwide from 1993 to 2023
- Premium Statistic Distribution of clothing, textile and footwear exports from Finland 2018, by product
- Premium Statistic Most popular sports shoes and sneaker brands in Germany 2013, by age groups
- Premium Statistic Bahamas: import value of footwear products 2015-2021
- Basic Statistic Consumer price index (CPI) of clothing and footwear in Sweden 2010-2021
- Premium Statistic Paraguay: import value of footwear products 2015-2022
- Premium Statistic Footwear: weekly household expenditure in the UK 2022, by category
Related statistics
10
- Premium Statistic Value of olive oil consumption in MENA 2016 by country
- Premium Statistic Breakfast cereals retail sales value in GCC 2012-2016
- Premium Statistic Impulse and indulgence products retail sales value in GCC type 2016
- Premium Statistic Chocolate confectionery products retail sales value in GCC 2012-2016
- Premium Statistic Ice cream products retail sales value in GCC 2012-2016
- Premium Statistic Packaged dairy products retail sales value in the UAE 2012-2016
- Premium Statistic Packaged dairy products retail sales value in Saudi Arabia 2012-2016
- Premium Statistic Meal solution products retail sales value in GCC type 2016
- Premium Statistic Packaged dairy products retail sales value in Oman 2012-2016
- Premium Statistic Sauces, dressings and condiments retail sales value in GCC 2012-2016
Further related statistics
10
- Mondelez International's net revenue distribution worldwide by sector 2022
- Mondelez International's operating income worldwide 2011-2022
- Mondelez International's global workforce by region 2012-2022
- The adidas Group's global net sales from 2002 to 2023, by product category
- Number of Hugo Boss stores worldwide in 2023, by region
- Hugo Boss - EBITDA 2005-2023
- Walgreens gross profit and net earnings in the U.S. 2005-2023
- Net sales of ConAgra Brands worldwide 2012-2023
- Net sales of ConAgra Brands worldwide 2015-2023, by segment
- Number of Hugo Boss stores worldwide in 2020, by store type
Further Content: You might find this interesting as well
Statistics
- Mondelez International's net revenue distribution worldwide by sector 2022
- Mondelez International's operating income worldwide 2011-2022
- Mondelez International's global workforce by region 2012-2022
- The adidas Group's global net sales from 2002 to 2023, by product category
- Number of Hugo Boss stores worldwide in 2023, by region
- Hugo Boss - EBITDA 2005-2023
- Walgreens gross profit and net earnings in the U.S. 2005-2023
- Net sales of ConAgra Brands worldwide 2012-2023
- Net sales of ConAgra Brands worldwide 2015-2023, by segment
- Number of Hugo Boss stores worldwide in 2020, by store type
APICCAPS. (August 1, 2019). Quantity of shoes consumed in Middle East and North Africa in 2018, by country (in million pairs) [Graph]. In Statista. Retrieved June 01, 2024, from https://www.statista.com/statistics/668558/consumption-of-shoe-by-select-mena-countries/
APICCAPS. "Quantity of shoes consumed in Middle East and North Africa in 2018, by country (in million pairs)." Chart. August 1, 2019. Statista. Accessed June 01, 2024. https://www.statista.com/statistics/668558/consumption-of-shoe-by-select-mena-countries/
APICCAPS. (2019). Quantity of shoes consumed in Middle East and North Africa in 2018, by country (in million pairs). Statista. Statista Inc.. Accessed: June 01, 2024. https://www.statista.com/statistics/668558/consumption-of-shoe-by-select-mena-countries/
APICCAPS. "Quantity of Shoes Consumed in Middle East and North Africa in 2018, by Country (in Million Pairs)." Statista, Statista Inc., 1 Aug 2019, https://www.statista.com/statistics/668558/consumption-of-shoe-by-select-mena-countries/
APICCAPS, Quantity of shoes consumed in Middle East and North Africa in 2018, by country (in million pairs) Statista, https://www.statista.com/statistics/668558/consumption-of-shoe-by-select-mena-countries/ (last visited June 01, 2024)
Quantity of shoes consumed in Middle East and North Africa in 2018, by country (in million pairs) [Graph], APICCAPS, August 1, 2019. [Online]. Available: https://www.statista.com/statistics/668558/consumption-of-shoe-by-select-mena-countries/