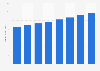
This statistic shows the average per capita expenditure on sports products in Spain in 2014, in euros per person. Golf represents the sports category people spent the highest amount of money on that year.
Average amount of money spent on sports products in Spain in 2014*, by product type (in euros per person)
Basic Account
Get to know the platform
You only have access to basic statistics.
This statistic is not included in your account.
Starter Account
The ideal entry-level account for individual users
- Instant access to 1m statistics
- Download in XLS, PDF & PNG format
- Detailed references
$199 USD / Month *
Professional Account
Full access
Business Solutions including all features.
* Prices do not include sales tax.
Other statistics that may interest you Sporting goods in the United States
Market Overview
8
- Premium Statistic Revenue of the sports equipment industry worldwide 2018-2028
- Premium Statistic Total revenue of the global sports apparel market 2023-2030
- Premium Statistic Revenue of the athletic footwear industry Worldwide 2018-2028
- Premium Statistic Revenue of the sports equipment industry in the U.S. 2018-2028
- Premium Statistic Sports equipment market revenue in the U.S. from 2018 to 2028, by product type
- Premium Statistic Revenue of the U.S. athletic apparel and swimwear market from 2018 to 2028
- Premium Statistic Revenue of the U.S. athletic apparel and swimwear market 2018-2028, by segment
- Premium Statistic Athletic footwear revenue in the United States 2018-2028
Retail
6
- Premium Statistic U.S. total and e-commerce sports, hobby, instrument, and book stores sales 2004-2022
- Premium Statistic Sporting goods store sales in the U.S. from 1992 to 2022
- Premium Statistic Sporting goods store monthly sales in the U.S. from 2017 to 2023
- Basic Statistic Mail-order and e-commerce sales of sporting goods in the U.S. 2003-2022
- Premium Statistic U.S. athletic and gymnastic equipment import and export trade value from 2015 to 2022
- Premium Statistic Consumer Price Index of sporting goods in the U.S. 1980-2023
Wholesale
8
- Basic Statistic Wholesale sales of the U.S. sporting goods industry in the U.S. 2008-2023
- Premium Statistic Wholesale sales of the sports products industry by category 2008-2023
- Premium Statistic Wholesale sales of sports apparel in the U.S. 2008-2023
- Premium Statistic Wholesale sales of athletic footwear in the U.S. 2008-2023
- Premium Statistic U.S. consumer fitness equipment wholesale sales 2007-2023
- Premium Statistic Wholesale sales of sports exercise equipment in the U.S. 2007-2023
- Premium Statistic Institutional fitness equipment wholesale sales in the U.S. 2007-2023
- Premium Statistic Wholesale sales of licensed sports merchandise in the U.S. 2008-2023
U.S. sporting goods manufacturers
8
- Basic Statistic Nike's global revenue 2005-2023
- Basic Statistic Nike's North American revenue 2009-2023, by segment
- Basic Statistic U.S. revenue of Nike from 1988 to 2023
- Basic Statistic Revenue of Topgolf Callaway Brands Corp. 2005-2023
- Basic Statistic Topgolf Callaway Brands Corp. revenue worldwide 2017-2023, by market
- Basic Statistic Revenue of Topgolf Callaway Brands Corp. worldwide 2017-2023, by product category
- Basic Statistic Under Armour's net revenue worldwide 2008-2024
- Basic Statistic Under Armour's net revenue in the United States from 2015 to 2024
U.S. sporting goods retail stores
8
- Basic Statistic Net sales of Dick's Sporting Goods U.S. 2006-2023
- Basic Statistic Net sales of Dick's Sporting Goods U.S. 2008-2023, by product type
- Basic Statistic Hibbett Sports' net sales in the U.S. from 2015 to 2024
- Basic Statistic Hibbett Sports' net sales in the U.S. from 2017 to 2024, by product category
- Basic Statistic Big 5 Sporting Goods' net sales in the U.S. from 2017 to 2023
- Basic Statistic Big 5 Sporting Goods' dollar sales share in the U.S. in 2023, by product category
- Premium Statistic Bass Pro Shop's retail sales in the U.S. from 2017 to 2022
- Basic Statistic Academy Sports' retail sales in the U.S. from 2017 to 2022
Further related statistics
10
- Net sales of Dick's Sporting Goods U.S. 2006-2023
- Alpine ski bindings and boots retail sales in the U.S. 2010-2016
- Total assets of Mizuno 2015
- U.S. snow sports stores snowboard boots retail inventory 2008/09-2012/13
- The adidas Group's global net sales from 2002 to 2023, by product category
- Preferred sports among Chinese millionaires 2024
- Number of Nike stores globally 2009-2023
- Most popular sporting activities in the U.S. in 2022
- Most popular outdoor activities among African Americans in the U.S. in 2017
- Revenues of VF Corporation's active segment worldwide 2016 to 2023
Further Content: You might find this interesting as well
Statistics
- Net sales of Dick's Sporting Goods U.S. 2006-2023
- Alpine ski bindings and boots retail sales in the U.S. 2010-2016
- Total assets of Mizuno 2015
- U.S. snow sports stores snowboard boots retail inventory 2008/09-2012/13
- The adidas Group's global net sales from 2002 to 2023, by product category
- Preferred sports among Chinese millionaires 2024
- Number of Nike stores globally 2009-2023
- Most popular sporting activities in the U.S. in 2022
- Most popular outdoor activities among African Americans in the U.S. in 2017
- Revenues of VF Corporation's active segment worldwide 2016 to 2023
El Observatorio Cetelem. (October 8, 2014). Average amount of money spent on sports products in Spain in 2014*, by product type (in euros per person) [Graph]. In Statista. Retrieved June 12, 2024, from https://www.statista.com/statistics/467948/per-capita-spendings-on-sports-products-in-spain/
El Observatorio Cetelem. "Average amount of money spent on sports products in Spain in 2014*, by product type (in euros per person)." Chart. October 8, 2014. Statista. Accessed June 12, 2024. https://www.statista.com/statistics/467948/per-capita-spendings-on-sports-products-in-spain/
El Observatorio Cetelem. (2014). Average amount of money spent on sports products in Spain in 2014*, by product type (in euros per person). Statista. Statista Inc.. Accessed: June 12, 2024. https://www.statista.com/statistics/467948/per-capita-spendings-on-sports-products-in-spain/
El Observatorio Cetelem. "Average Amount of Money Spent on Sports Products in Spain in 2014*, by Product Type (in Euros per Person)." Statista, Statista Inc., 8 Oct 2014, https://www.statista.com/statistics/467948/per-capita-spendings-on-sports-products-in-spain/
El Observatorio Cetelem, Average amount of money spent on sports products in Spain in 2014*, by product type (in euros per person) Statista, https://www.statista.com/statistics/467948/per-capita-spendings-on-sports-products-in-spain/ (last visited June 12, 2024)
Average amount of money spent on sports products in Spain in 2014*, by product type (in euros per person) [Graph], El Observatorio Cetelem, October 8, 2014. [Online]. Available: https://www.statista.com/statistics/467948/per-capita-spendings-on-sports-products-in-spain/