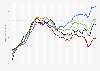
This statistic shows the U.S. merchant wholesalers' gross margin as a share of durable goods sales from 2002 to 2021. In 2021, the gross margin's share of durable goods sales in U.S. wholesale amounted to 26.9 percent. Durable goods include: motor vehicle and motor vehicle parts and supplies; furniture and home furnishings; lumber and other construction materials; professional and commercial equipment and supplies; computer and computer peripheral equipment and software; metals and minerals (excluding petroleum); electrical goods; hardware, and plumbing and heating equipment and supplies; machinery, equipment, and supplies; as well as miscellaneous durable goods.
U.S. merchant wholesalers' gross margin as a share of durable goods sales from 2002 to 2021
Loading statistic...
Basic Account
Get to know the platform
You only have access to basic statistics.
Starter Account
The ideal entry-level account for individual users
- Instant access to 1m statistics
- Download in XLS, PDF & PNG format
- Detailed references
$199 USD / Month *
Professional Account
Full access
Business Solutions including all features.
* Prices do not include sales tax.
Other statistics that may interest you Statistics on
About the industry
10
- Basic Statistic Gross margin as a share of nondurable goods sales in U.S. wholesale from 2002 to 2020
- Basic Statistic Gross margin on goods in U.S. wholesale from 2002 to 2018
- Basic Statistic Gross margin as a share of apparel sales in U.S. wholesale 1993-2022
- Basic Statistic Gross margin as a share of grocery sales in U.S. wholesale 1993-2022
- Basic Statistic Gross margin as a share of furniture sales in U.S. wholesale 1993-2022
- Basic Statistic Gross margin as a share of electrical goods sales in U.S. wholesale 2000 to 2017
- Basic Statistic Gross margin as a share of motor vehicle sales in U.S. wholesale 2000-2016
- Basic Statistic Gross margin on durable goods in U.S. wholesale 2002-2022
- Basic Statistic Gross margin on groceries in U.S. wholesale 1993-2022
- Basic Statistic Gross margin on apparel in U.S. wholesale 2000-2014
About the region
10
- Basic Statistic Gross margin as a share of beer sales in U.S. wholesale 2002-2021
- Basic Statistic Gross margin as a share of paper sales in U.S. wholesale 1993-2010
- Premium Statistic Gross margin on beer and wine in U.S. wholesale 2002-2021
- Basic Statistic Gross margin on drugs in U.S. wholesale 1993-2010
- Basic Statistic Gross margin on furniture in U.S. wholesale 1993-2022
- Basic Statistic Gross margin on nondurable goods in U.S. wholesale from 2002 to 2022
- Basic Statistic Gross margin on lumber in U.S. wholesale 1993-2010
- Basic Statistic U.S. wholesale sales of durable goods from 2002 to 2022
- Basic Statistic Total U.S. wholesale goods sales 2002-2022
- Premium Statistic Export of commodities from the United States 2022
Other regions
10
- Premium Statistic Import of goods to Afghanistan 2022
- Premium Statistic Export of commodities from Tunisia 2022
- Premium Statistic Export of commodities from Venezuela 2022
- Premium Statistic Export of commodities from the Netherlands 2022
- Premium Statistic Export of commodities from Luxembourg 2022
- Premium Statistic Export of commodities from Turkey 2022
- Premium Statistic Export of commodities from Montenegro 2022
- Premium Statistic Export of commodities from Thailand 2022
- Premium Statistic Export of commodities from Romania 2022
- Premium Statistic Export of commodities from Mali 2022
Related statistics
10
- Premium Statistic Change in sales of personal goods wholesalers in Canada 2012-2023
- Basic Statistic Total U.S. wholesale purchases of durable goods from 2002 to 2017
- Basic Statistic Total U.S. wholesale goods purchases from 2002 to 2017
- Basic Statistic Value of U.S. wholesale durable goods inventories from 2002 to 2017
- Premium Statistic Net sales of the largest global home improvement products companies 2013
- Premium Statistic Net sales of the leading home appliance manufacturers worldwide 2013
- Basic Statistic Net sales of the largest global home improvement products companies 2010
- Basic Statistic U.S. wholesale sales of furniture and home furnishings 2002-2022
- Basic Statistic Total U.S. wholesale sales of nondurable goods from 2002 to 2022
- Basic Statistic U.S. wholesale sales of apparel, piece goods, and notions 2002-2022
Further related statistics
10
- Under Armour's operating income worldwide 2008-2023
- Mondelez International's net revenue distribution worldwide by sector 2022
- Mondelez International's operating income worldwide 2011-2022
- Mondelez International's global workforce by region 2012-2022
- Victoria's Secret's net sales worldwide from 2010 to 2023
- U.S. premium wineries' pretax profit 2002-2022
- Net sales of ConAgra Brands worldwide 2012-2023
- Net sales of ConAgra Brands worldwide 2015-2023, by segment
- U.S. milk sales growth: leading vendors of white milk 2023
- Leading vendors of baby formula (powder) in the U.S. 2016
Further Content: You might find this interesting as well
Statistics
- Under Armour's operating income worldwide 2008-2023
- Mondelez International's net revenue distribution worldwide by sector 2022
- Mondelez International's operating income worldwide 2011-2022
- Mondelez International's global workforce by region 2012-2022
- Victoria's Secret's net sales worldwide from 2010 to 2023
- U.S. premium wineries' pretax profit 2002-2022
- Net sales of ConAgra Brands worldwide 2012-2023
- Net sales of ConAgra Brands worldwide 2015-2023, by segment
- U.S. milk sales growth: leading vendors of white milk 2023
- Leading vendors of baby formula (powder) in the U.S. 2016
US Census Bureau. (December 14, 2022). U.S. merchant wholesalers' gross margin as a share of durable goods sales from 2002 to 2021 [Graph]. In Statista. Retrieved June 01, 2024, from https://www.statista.com/statistics/199663/share-of-gross-margin-of-durable-goods-sales-in-us-wholesale-since-1993/
US Census Bureau. "U.S. merchant wholesalers' gross margin as a share of durable goods sales from 2002 to 2021." Chart. December 14, 2022. Statista. Accessed June 01, 2024. https://www.statista.com/statistics/199663/share-of-gross-margin-of-durable-goods-sales-in-us-wholesale-since-1993/
US Census Bureau. (2022). U.S. merchant wholesalers' gross margin as a share of durable goods sales from 2002 to 2021. Statista. Statista Inc.. Accessed: June 01, 2024. https://www.statista.com/statistics/199663/share-of-gross-margin-of-durable-goods-sales-in-us-wholesale-since-1993/
US Census Bureau. "U.S. Merchant Wholesalers' Gross Margin as a Share of Durable Goods Sales from 2002 to 2021." Statista, Statista Inc., 14 Dec 2022, https://www.statista.com/statistics/199663/share-of-gross-margin-of-durable-goods-sales-in-us-wholesale-since-1993/
US Census Bureau, U.S. merchant wholesalers' gross margin as a share of durable goods sales from 2002 to 2021 Statista, https://www.statista.com/statistics/199663/share-of-gross-margin-of-durable-goods-sales-in-us-wholesale-since-1993/ (last visited June 01, 2024)
U.S. merchant wholesalers' gross margin as a share of durable goods sales from 2002 to 2021 [Graph], US Census Bureau, December 14, 2022. [Online]. Available: https://www.statista.com/statistics/199663/share-of-gross-margin-of-durable-goods-sales-in-us-wholesale-since-1993/